 Diagramm
OK.Wahl
Internetpräsentation
Version 2.2.12
Vorläufiges Ergebnis zur Landtagswahl 2018 am 14.10.2018
Stimmkreis Ansbach-Nord - Kreisfreie Stadt Ansbach
Es wurden alle Stimmbezirke ausgewertet.
Navigationskarte
Die Gemeinden werden mit der Farbe der Partei, welche die meisten Zweitstimmen hat, eingefärbt.
Durch Mausklick auf die gewünschte Partei wird der Stimmenanteil in % durch farbliche Abstufung in der Karte dargestellt.
Durch Mausklick auf die gewünschte Partei wird der Stimmenanteil in % durch farbliche Abstufung in der Karte dargestellt.
Die Karte kann zusätzlich zur Navigation zu den einzelnen Gemeinden verwendet werden.
 Seitenanfang
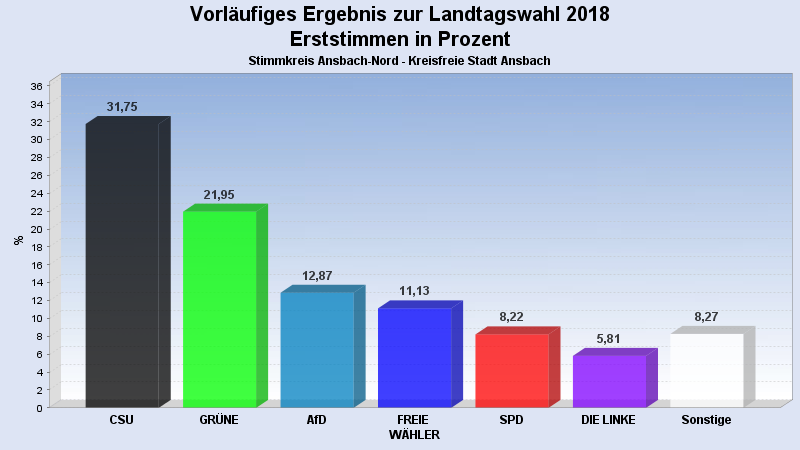
Wahlbeteiligung, Stimmzettel, Stimmen
| Wahlbeteiligung: | 63,03% |
|---|---|
| Stimmberechtigte: | 30.724 |
| Wähler: | 19.366 |
| Ungültige Erststimmen: | 138 |
| Gültige Erststimmen: | 19.227 |
| Ungültige Zweitstimmen: | 224 |
| Gültige Zweitstimmen: | 19.142 |
Erststimmen nach Wahlvorschlag
| Partei | Erststimmen | Prozent | |
|---|---|---|---|
| 1 | Schalk, Andreas (CSU) | 6.104 | 31,75% |
| 4 | Stümpfig, Martin (GRÜNE) | 4.221 | 21,95% |
| 11 | Meier, Johannes (AfD) | 2.474 | 12,87% |
| 3 | Dr. Bauer, Peter (FREIE WÄHLER) | 2.140 | 11,13% |
| 2 | Ringler, Norbert (SPD) | 1.580 | 8,22% |
| 6 | Beuckert, Michael (DIE LINKE) | 1.118 | 5,81% |
| 5 | Hanel, Alexander (FDP) | 673 | 3,50% |
| 8 | Brendle-Behnisch, Günther (ÖDP) | 311 | 1,62% |
| 10 | Wagner, Klaus (DIE FRANKEN) | 272 | 1,41% |
| 9 | Reitmaier, Peter (PIRATEN) | 150 | 0,78% |
| 7 | Rinke, Klaus-Peter (BP) | 104 | 0,54% |
| 15 | Sibai, Amina (V-Partei³) | 80 | 0,42% |
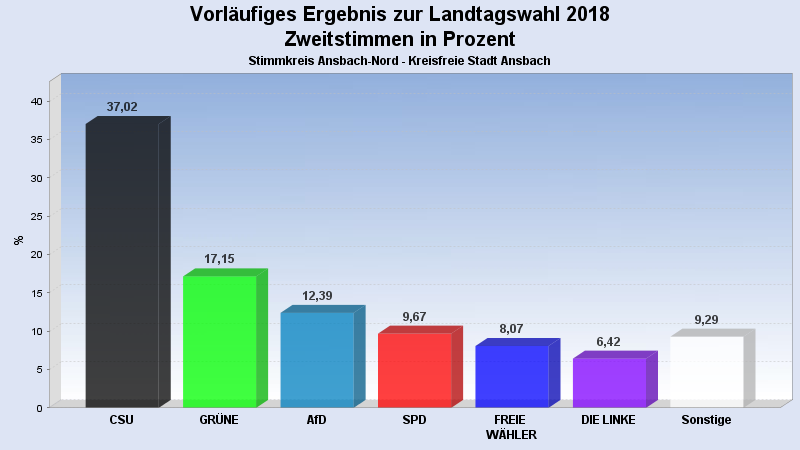
Zweitstimmen nach Wahlvorschlag
| Partei | Zweitstimmen | Prozent | |
|---|---|---|---|
| 1 | CSU | 7.087 | 37,02% |
| 4 | GRÜNE | 3.282 | 17,15% |
| 11 | AfD | 2.371 | 12,39% |
| 2 | SPD | 1.851 | 9,67% |
| 3 | FREIE WÄHLER | 1.544 | 8,07% |
| 6 | DIE LINKE | 1.229 | 6,42% |
| 5 | FDP | 629 | 3,29% |
| 8 | ÖDP | 486 | 2,54% |
| 10 | DIE FRANKEN | 155 | 0,81% |
| 13 | Die PARTEI | 136 | 0,71% |
| 9 | PIRATEN | 125 | 0,65% |
| 7 | BP | 83 | 0,43% |
| 12 | mut | 76 | 0,40% |
| 15 | V-Partei³ | 64 | 0,33% |
| 14 | Gesundheitsforschung | 24 | 0,13% |
- Stand: 14.10.2018 23:43:37